

Digital Elevation Models (DEMs) with Drones: Creating Digital Surface Models and Terrain Models for Real-World Analysis

A Digital Terrain Model (DTM) showing the bare earth terrain of a forested site, generated from drone LiDAR after vegetation and canopy layers were removed.
When it comes to working with terrain—whether for planning, infrastructure, environmental monitoring, or resource management—accurate elevation data is essential. Digital Elevation Models (DEMs) offer a powerful way to visualize and analyze the Earth's surface in 2.5D (more on this later), and drone technology has made capturing that data more accessible and accurate than ever.
Through drone-based LiDAR and photogrammetry, it's now possible to generate detailed elevation models that support everything from flood modeling and slope analysis to construction site grading and forest mapping. These models provide a practical, high-resolution alternative to other remote-sensing data collection using satellite or traditional survey methods—especially for localized projects.
This article looks at what DEMs are, how they're created using drone workflows, the difference between DSMs and DTMs, and how they’re used in real-world projects. Whether you're new to elevation data or looking to refine how you use it in your work, this guide covers the essentials.
Key Takeaways
Digital Elevation Models (DEMs) provide essential 3D elevation data for terrain analysis, site planning, and environmental monitoring.
Drone-based workflows — including LiDAR and photogrammetry — allow for fast, accurate DEM generation with centimeter-level vertical accuracy.
DSM vs. DTM: DSMs include surface features like trees and buildings, while DTMs represent the bare earth. Each serves different project needs.
The resolution and accuracy of a DEM depend on flight altitude, sensor quality, ground control, and classification — all of which can be planned and optimized.
DEMs are used across industries, supporting workflows like flood risk mapping, cut/fill analysis, forest management, and slope modeling.
Visualizing DEMs in 2D/3D, overlaying orthophotos, and applying hillshades or relief maps all enhance terrain understanding.
With proper QA/QC, drone-captured DEMs are a reliable alternative to traditional survey methods — and often faster, more scalable, and more cost-effective.
What is a Digital Elevation Model (DEM)?
A Digital Elevation Model (DEM) represent the topographic surface of the Earth by assigning elevation values to a regular grid of points.
It’s commonly used in mapping, analysis, and modeling workflows to understand how terrain varies across a landscape.
Despite being able to be visualized in 3D, a DEM is technically 2.5D. That means each XY coordinate (a grid cell or pixel) is assigned a single Z value — the elevation. It can’t capture complex vertical structures like overhangs, bridges, or tunnels, but it does a great job of representing the top surface of the terrain.
DEMs are usually stored as raster grids, where each cell in the grid corresponds to a fixed area on the ground — for example, 1x1 meter or 10x10 meter resolution — and contains the elevation value for that spot. The finer the resolution, the more detail the DEM can provide.
Depending on how they’re captured and processed, DEMs can model the bare earth surface (DTM) or the surface including trees, buildings, and other structures (DSM). This makes them extremely versatile tools for industries ranging from construction and civil engineering to forestry and floodplain mapping.
Types of Digital Elevation Models
Not all elevation models show the same thing. Depending on how the data is processed — and what features you want to include or exclude — there are different types of DEMs to work with. The most common are:
Digital Surface Model (DSM)
As the name suggests, a Digital Surface Model (DSM) represents everything on the land surface — not just the ground, but also trees, buildings, utility poles, and other structures. This makes it useful in urban planning, telecommunications, forestry, and any application where you need to understand how surface features interact with each other or with the terrain.
Drone-based DSMs are typically created using either photogrammetry (from geotagged RGB images) or LiDAR point clouds, depending on the sensor. In forested areas, for example, the DSM will show canopy height, which can be useful for estimating biomass or modeling tree cover.
Digital Terrain Model (DTM)
A Digital Terrain Model (DTM) represents the bare earth DEM — meaning all vegetation, buildings, and other above-ground features are removed. DTMs are essential for hydrological modeling, site grading, flood risk assessments, and any analysis where understanding bare earth terrain and surface flow is critical.
DTMs can be extracted from drone LiDAR data using ground classification algorithms that filter out non-ground points. They can also be created from photogrammetry, however this requires good ground visibility and ground control points (GCPs) for best results. Any obstruction between the drone and the ground, like trees, will not provide adequate photogrammetric point density and therefore will need to be interpolated or left as “holes” with zero values in the DTM.
Choosing the Right Model

Side-by-side view of the same area in LiDAR360 showing a Digital Terrain Model (left), with surface features removed to reveal the bare earth, and a Digital Surface Model (right), which includes the Forest vegetation.
Whether a DSM or DTM is more appropriate depends entirely on the project. For example:
A DSM might be used to model solar access on rooftops or analyze tree heights in a reforestation area.
A DTM would be more appropriate for a drainage study, where knowing the true ground elevation is key.
In many cases, both are delivered together. One showing what’s on the surface, the other showing what’s underneath.
Creating DEMs with Drones
Drone mapping workflows rely on advanced remote sensing techniques like LiDAR (Light Detection and Ranging), photogrammetry, and multispectral imaging to produce accurate elevation models. These methods allow for flexibility in data collection depending on terrain, vegetation, and project requirements.
Photogrammetry-Based DEMs
Photogrammetry involves capturing a large number of overlapping aerial geotagged-images using the drones RGB camera. These images are processed using photogrammetry software like Pix4D, DJI Terra, or Agisoft Metashape to reconstruct the terrain in 3D. The result is a dense point cloud that can be used to generate either a DSM or, with proper filtering and classification, a DTM. Pix4D Mapper can create both DSM and DTM, whereas Pix4D Matic can create only a DSM and requires additional software to classify the dense point cloud to and create a DTM.
Accuracy depends heavily on ground control points (GCPs), RTK/PPK positioning, and consistent overlap and flight altitude. Photogrammetry is ideal for open, unobstructed areas like fields, roads, or construction sites — but it's less effective in dense vegetation, where the ground isn’t clearly visible.
LiDAR-Based DEMs
For projects that require precise elevation data in areas with vegetation, structures, or variable terrain, drone LiDAR is a better choice over photogrammetry. LiDAR (Light Detection and Ranging) sensors emit laser pulses that penetrate vegetation and return elevation points from the ground surface, tree canopy, and other features. This allows for the creation of both DSMs and highly accurate DTMs, even in forested or overgrown environments.
Point cloud classification is used to separate ground points from non-ground returns, which is key to producing a reliable terrain model. With the right settings and flight planning, LiDAR can generate highly accurate DTM’s even in areas where photogrammetry will struggle.
DEM Workflow Overview
Regardless of the capture method, producing a reliable DEM typically involves:
Careful flight planning to ensure consistent coverage and overlap for required point density and spacing
Use of RTK/PPK systems and/or GCPs for spatial accuracy
Post-processing to generate and classify point clouds
Creating raster surfaces from point cloud data, filtered by class or elevation
Exporting DEMs in formats like GeoTIFF for use in GIS platforms
Applications of DEMs
Digital Elevation Models play an important role in a wide range of industries — especially when captured and processed with drone-based workflows. Whether it's understanding landform behavior, modeling how water moves across a site, or visualizing terrain for engineering, DEMs help transform raw elevation data into actionable insight.
Here are some of the most common and impactful applications:
Flood Risk Modeling & Drainage Analysis

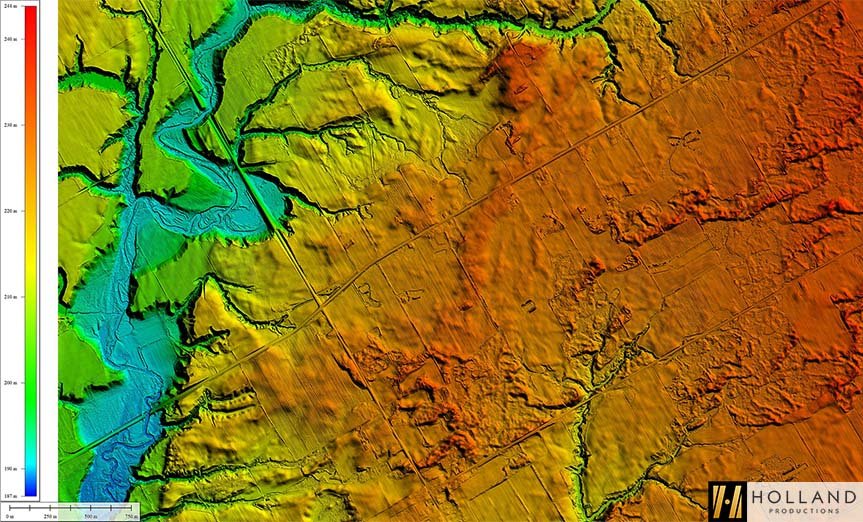
A drainage network and flow path analysis generated from a Digital Terrain Model (DTM). Elevation data was derived from drone LiDAR to visualize surface runoff patterns across a forested site.
One of the most common applications of DEMs is modeling how water moves across terrain. DTMs are used in flow direction studies to identify low-lying areas, surface runoff paths, and accumulation zones, which are all essential for drainage planning and flood risk modeling. When captured with drones, high-resolution DTMs offer far more local detail than satellite datasets, making them ideal for site-specific and localized floodplain mapping and stormwater studies.
Construction & Site Planning
Before earthworks begin, DEMs can be used to evaluate slope, elevation change, and cut/fill volumes. A DTM provides a baseline surface for grading, foundation planning, or road alignment, while DSMs help visualize how new structures might interact with the surrounding terrain. Drones allow for rapid updates, meaning DEMs can be captured at different stages of a project for progress tracking or compliance reporting.
Forestry & Vegetation Analysis
In forested environments, drone LiDAR data is especially valuable. A DSM captures canopy height and structure, while a DTM shows the underlying terrain. Comparing the two by creating a Canopy Height Model (CHM) can help estimate biomass, identify tree heights, or evaluate forest thinning impacts. DEMs are also used in planning forest road networks, skid trails, and cutblock boundaries — especially where access is limited.
Infrastructure & Transportation
DEMs support route planning for roads, pipelines, and power lines by highlighting terrain constraints, slope gradients, and elevation profiles. With drone data, planners can identify areas of concern (like steep slopes or unstable terrain) early in the design process, reducing the risk of costly surprises during construction.
Environmental Monitoring & Change Detection
By comparing DEMs captured at different times, it’s possible to detect erosion, sediment buildup, landslide movement, or shoreline retreat. This kind of analysis is often used in geological survey and environmental monitoring work, where understanding terrain changes over time is critical. Drones make this process efficient and repeatable, giving teams a powerful tool for tracking and quantifying land surface changes at scale.
Data Sources for DEMs
There are a variety of ways to obtain elevation data — from freely available global datasets to high-resolution site-specific models captured by drones. Choosing the right data source depends on the scale, accuracy, and detail your project requires.
Global and Satellite-Based DEMs
Global DEMs are useful for large-scale regional analysis, especially when high precision isn’t required. Common sources include:
SRTM (Shuttle Radar Topography Mission) – Captured in 2000 by NASA, Shuttle Radar Topography Mission, SRTM provides near-global coverage at 30 m resolution. It’s widely used and freely available via platforms like USGS Earth Explorer.
ASTER GDEM – Offers global coverage with 30 m resolution (in the U.S.) and around 90 m elsewhere. ASTER data is useful but may have artifacts or voids in areas with persistent cloud cover.
ALOS World 3D (JAXA) – A global DSM with 30 m resolution, derived from stereo optical imagery. Good for general terrain context, particularly in mountainous regions.
High Resolution DEM (HRDEM – CanElevation Series, NRCan)
Sample from NRCan’s High Resolution DEM (HRDEM) showing bare earth terrain at 1 m resolution. While suitable for regional analysis, drone-based DEMs offer significantly more surface detail for site-specific work.
Want to see how our 5 cm drone-based DTM compares to NRCans HRDEM? Jump to the Accuracy and Resolution section to see a side-by-side example where we will zoom in on a section of this DTM.
NRCan’s High Resolution Digital Elevation Model (HRDEM) is part of the CanElevation Series, created to support the National Elevation Data Strategy. It offers detailed DSM and DTM products across Canada, primarily derived from airborne LiDAR in the south and stereo satellite imagery in the north, with coverage expanding through ongoing projects.
Resolutions:
Southern Canada (LiDAR): 1 m or 2 m
Northern Canada (satellite-based): 2 m
Coverage Areas:
10×10 km or 20×20 km (LiDAR)
50×50 km (satellite-derived DSM)
Projections: UTM NAD83(CSRS) or Polar Stereographic North (WGS84)
Vertical Datum: CGVD2013
Derived Products: Slope, aspect, shaded relief, color relief, and combined terrain maps
Applications: Flood modeling, forestry, land development, infrastructure planning, and terrain analysis
The data is acquired through collaborative projects and may not be edge-matched between tiles, though it remains highly accurate within each project boundary.
Explore HRDEM on Canada’s Open Data Portal
While these sources are helpful for overview studies, their resolution and vertical accuracy are often not sufficient for engineering or site planning tasks.
Drone-Captured DEMs
For projects that demand centimeter-level accuracy and fine detail, drone-captured elevation data is the best choice. Whether using LiDAR or photogrammetry, drones provide:
Flexible data collection over specific areas, at the scale you need
High spatial resolution — centimeter grid resolution
Vertical accuracy that meets or exceeds survey-quality requirements, when using survey-grade sensors combined with RTK/PPK and survey-grade ground control points
Drone-based DEMs are ideal for applications like:
Site grading and cut/fill volume analysis
Vegetation management and canopy height modeling
Drainage and hydrological studies
Pre-construction and post-earthwork surveys
In many cases, teams use global DEMs for background context, and drone-based data for the high-accuracy modeling that decisions are based on.
Accuracy and Resolution of DEMs
When working with elevation models, especially for engineering, planning, or environmental studies, the accuracy and resolution of the data are critical. The more precisely a DEM represents the real-world terrain, the more reliable your analysis and decisions will be.
Vertical Accuracy
Vertical accuracy refers to how closely a DEM’s elevation values match the actual height of the terrain. In drone workflows, accuracy depends on several factors:
The sensor type (LiDAR vs. photogrammetry)
Use of RTK/PPK positioning and ground control points (GCPs)
Flight altitude, image overlap, and surface complexity
The classification quality of the point cloud (especially for DTMs)
There are two key types of accuracy to keep in mind:
Absolute accuracy: How close the DEM elevations are to their true position in a global coordinate system (e.g., NAD83, WGS84). This is critical for engineering surveys and GIS integration.
Relative accuracy: How consistent elevation values are within the dataset. High relative accuracy means the surface model is internally smooth and reliable — even if it’s slightly offset from real-world coordinates.
One common way to measure vertical accuracy is using Root Mean Square Error (RMSE) — a statistical form of square error that compares known ground elevations with the DEM’s predicted values. Lower RMSE values indicate better vertical accuracy.
Spatial Resolution
DEM resolution is defined by the distance between elevation values, often expressed as the grid size or pixel size (e.g., 1 meter , 25 cm). Higher-resolution DEMs capture more detail but also increase data volume and processing requirements.
Drone-captured DEMs typically range from a few centimeters to 1 meter resolution, depending on flight altitude, camera or LiDAR specs, and the desired output scale. However higher resolution DEM’s can be used in specific scenarios like Archeology discovery where extreme detail can be very important in detailed discoveries.
Check out the comparison below between NRCan’s HRDEM (left) for the same land areas we flew with our drone-based LiDAR (right). The accuracy and detail is very impressive for the HRDEM DTM but does not compare to the spatial resolution we can achieve with drone-based LiDAR for site specific areas.

Resolution comparison between NRCan’s 1 m Digital Terrain Model (left) and a 5 cm DTM captured by drone (right). Fine terrain features — like micro-drainage patterns, subtle slopes, small elevation changes, and even lost overgrown logging trails, are lost in the lower-resolution model.
To highlight the difference in detail, the two models below are showing the exact same area.

Aligned resolution comparison of the same forested area using two Digital Terrain Models (DTMs): NRCan’s 1 m HRDEM (left) and our 5 cm drone-based DTM (right). Both models cover the exact same location, clearly showing how higher resolution captures finer terrain features such as micro-channels, subtle elevation changes, and surface texture.
High vertical resolution is especially important for detecting subtle changes in terrain elevation, such as low-slope drainage patterns or minor grading differences.
Point Cloud Density and DEM Resolution
The point spacing of the source data — whether from LiDAR or photogrammetry — directly affects the quality and resolution of the DEM. For example:
A point cloud with 10 points per square metre (ppsm) may support a 25–50 cm DEM.
Denser point clouds (e.g., 200+ ppsm from LiDAR) allow for sub-decimeter DTMs with excellent surface definition.
Estimating DEM Resolution with Point Cloud Density
The resolution of a DEM depends on the density of points captured during your drone flight — whether by LiDAR or photogrammetry. In practical terms, more points per square metre = higher resolution and more accurate surface modeling.
Factors like flight altitude, sensor resolution, image overlap, and ground sampling distance (GSD) all play a role in how dense the resulting point cloud will be.
To make this easier to estimate, we’ve created a Point Density & DEM Resolution Calculator. This tool helps predict how different drone flight settings will affect your deliverables.
Common Errors in DEMs
Even with high-quality drone data and careful processing, Digital Elevation Models can contain errors. Understanding where these come from helps ensure better accuracy, and helps clients interpret the results more confidently.
Blunders
Blunders are large, obvious elevation errors — often caused by incorrect image matching, GPS spikes, or noisy LiDAR returns. In photogrammetry, they might show up as floating surfaces, pits, or spikes. In LiDAR data, they can appear when reflective surfaces (like vehicles or water) return false points.
These errors can usually be identified and removed during quality control.
Systematic Errors
Systematic errors are more subtle — caused by predictable flaws in the data collection or processing workflow. Examples include:
Incorrect or mismatched coordinate systems
Uncalibrated or drifting IMU data
Image distortion due to lens characteristics
DTMs where vegetation wasn’t fully removed
These often require post-processing adjustments, reprocessing with corrected metadata, or validation using control points.
Random Errors
Random errors come from unpredictable influences: lighting conditions, wind, sensor noise, or minor GPS inaccuracies. These are harder to isolate and correct, but they can be reduced by:
Increasing image overlap or LiDAR point density
Flying under consistent lighting conditions (e.g., avoid early morning shadows)
Using GCPs and careful ground truthing to cross-check results
Why It Matters
If a DEM contains undetected or uncorrected errors, it can lead to faulty measurements — like wrong drainage flow paths, inaccurate cut/fill volumes, or misleading slope profiles.
That’s why a robust QA/QC workflow is essential — including visual inspection, elevation cross-checks, point cloud filtering, and comparing against GCPs.
DEM Quality Control Checklist
Before delivering a Digital Elevation Model, it's essential to validate its accuracy and consistency. Here are key QA/QC steps I recommend — and routinely follow — for every project:
1. Visual Inspection
Look for obvious spikes, pits, or floating surfaces in the DEM or point cloud.
Check for surface noise or irregularities in areas with dense vegetation or water.
2. Ground Control Cross-Check
Compare DEM elevations with known GCPs or checkpoints to verify vertical accuracy.
Look for consistent deviations (systematic error) or large local mismatches (blunders).
3. Coordinate System Verification
Ensure the DEM is referenced to the correct horizontal and vertical datum (e.g., UTM NAD83 (CSRS), CGVD2013).
Confirm that output matches client/project specs.
4. Point Cloud Classification
For DTMs, validate that non-ground points (trees, buildings, cars) are correctly filtered out.
Manually inspect areas where automatic classification may have failed (e.g., edge of forest and open field).
5. Metadata Review
Verify flight parameters (altitude, overlap, GPS status).
Double-check output resolution, spacing, and file naming.
A well-documented QC process builds trust and ensures your DEMs are ready for technical workflows — from civil engineering to environmental modeling.
Visualizing DEMs
Once a Digital Elevation Model has been generated, visualizing it properly is key to interpreting and using the data. Whether you're analyzing slope, identifying low points for drainage, or overlaying structures on a terrain model, clear visuals help translate raw elevation data into actionable insight.
DEMs in GIS Platforms
DEMs are typically imported into GIS software like QGIS, ArcGIS, or Global Mapper, where they can be rendered as:
Shaded relief (hillshade) for terrain perception
Color relief maps to show elevation differences
Contour lines for topographic analysis
Slope and aspect maps to understand surface gradients and orientation
These tools allow for both 2D and 3D views, making it easier to communicate terrain characteristics with clients, planners, or stakeholders.
3D Terrain Models
In many projects, we deliver DEMs alongside Point Clouds and 3D models or interactive web scenes. These can be used to:
Simulate water flow or erosion
Visualize proposed development relative to surrounding terrain
Present elevation profiles or cross-sections for roads, trails, or pipelines
Orthophotos + DEM Overlays

Orthophoto overlaid on a Digital Terrain Model (DTM), combining visual context with terrain data to highlight slopes, drainage paths, and bare earth features.
Combining an orthomosaic with a DEM enables layered insights — for example:
Viewing surface elevation with visible features like roads, buildings, or tree cover
Assessing land use patterns alongside slope or terrain classification
Comparing DSM vs. DTM to highlight vegetation height or surface structures
This kind of layered output is often provided as part of a standard deliverable, especially for environmental, planning, and civil projects.
Case Studies: DEMs in Action
From forestry to construction to environmental work, Digital Elevation Models are central to many of the drone projects we deliver. Here are a few real-world examples where DEMs played a critical role in the outcome.
Forest Block Mapping & Canopy Height Analysis
Project: A 550 acre managed forest site was mapped using drone-based LiDAR and photogrammetry to support harvest planning and reforestation.
Workflow:
A DSM captured full canopy structure.
A DTM was extracted to reveal the underlying terrain.
The difference between DSM and DTM produced a canopy height model (CHM) to assess stand density and tree height variability.
Outcome: The client used this data to evaluate thinning opportunities and optimize skid trail layout based on slope and access.
Summary
Digital Elevation Models (DEMs) are foundational to understanding and working with terrain data. Whether you're planning infrastructure, managing natural resources, or analyzing site conditions, a high-quality DEM provides the spatial resolution, clarity and surface detail needed to make informed decisions.
With drone-based workflows, capturing high-resolution DEMs has become faster, more affordable, and more precise than ever before. Choosing between DSMs, DTMs, or combining them both depends on the application, and the resolution of your deliverable is closely tied to flight planning, sensor type, and ground control.
From project planning to flood modeling and forest mapping, DEMs play a critical role across a wide range of industries. Understanding how they’re created, what affects their accuracy, and how to interpret them ensures you're getting the most from your data.
Ready to Map Your Site?
If you need high-resolution elevation data for your next project — whether it's for site planning, drainage analysis, or environmental monitoring — we can help.
Get in touch to learn how drone-based DEMs can support your goals.
Frequently Asked Questions
What’s the difference between a DSM and a DTM?
A DSM (Digital Surface Model) includes everything on the surface, including trees, buildings, vehicles, power lines, etc. A DTM (Digital Terrain Model) shows only the bare ground, with all surface objects removed. Each serves a different purpose depending on the project.
Can drones create accurate elevation models?
Yes — with proper planning, RTK/PPK positioning, and ground control, drones can produce centimeter-level vertical accuracy. LiDAR systems are ideal for complex or vegetated areas, while photogrammetry works well in open environments with hard surfaces.
Do I DEM’s need GCPs (Ground Control Points)?
GCPs aren’t always required, especially if you're using high-end RTK or PPK-equipped drones. But for maximum absolute accuracy, GCPs are still the best way to verify and correct your DEM data.
How do I view or use a DEM?
DEMs are typically delivered as GeoTIFF files and can be opened in GIS software like QGIS, ArcGIS, or Global Mapper. We also offer visualizations, overlays, and 3D models for easy interpretation, even without specialized software.
What resolution should I expect?
DEM resolution depends on the type of project and deliverables , flight altitude, and sensor used. Typical drone-based DEMs range from 25 cm to 5 cm resolution. Our DEM Resolution Calculator can help you estimate what’s possible based on your specs.
Try the calculator here: