

Drone Mapping in Windy Conditions: Best Practices for Efficient Data Collection
Topics Covered
The impact of wind on drone performance and mapping results.
Pre-flight considerations to ensure successful missions in high winds.
Adjustments to in-flight settings to improve stability and accuracy.
Post-flight validation techniques to ensure data quality.
Real-world lessons from mapping missions in windy conditions.
How Wind Affects Drone Mapping
If you’ve ever had to cancel a drone mission last-minute because of wind changes, you’re not alone. Weather is one of the biggest challenges in drone mapping. Even with the best weather planning and checking between forecasts and current weather conditions, things can change quickly.
With experience, you get better at making the call ahead of time but no matter what it’s a tough call to make to reschedule a job for a client who is eager to collect the data.
As the Pilot in Command (PIC) you are responsible for your equipment, flight operations and ensuring your drone operates within it’s safe limits. Always follow the recommended guidelines in your user manual and never exceed the recommended limits for your drone.
For those windy days, I wanted to take a look at flight planning parameters and see what the best and most efficient flight parameters are specifically for quadcopter drones.
Wind Speed and Drone Speed Converter
Before we get into things, I just wanted to provide a link to my Wind Speed and Drone Speed Converter, as you may use different units of speed for both the drone and wind. I typically use Meters per Second (m/s) when working with drone speeds and Kilometers per Hour (km/h) when working wind wind and forecasts.
Wind’s Impact on Drone Mapping: The 4 Biggest Problems
Tailwinds: The drone may fly faster than planned, leading to gaps in image overlap.
Headwinds: The drone slows down, taking too many images in the same area, which wastes storage and processing time.
Crosswinds: The drone can maintain speed but may experience yaw instability, which affects image alignment.
Wind Gusts: Sudden gusts can disrupt altitude hold, creating inconsistent ground sampling distance (GSD).
This topic idea came to me after I was hired to process another pilots’ drone survey data from a mapping mission, using both photogrammetry and LiDAR.
I was told by the pilot that it was extremely windy on the day of the drone survey, but even knowing this, I was quite shocked to see the data after I uploaded the images to Pix4D Matic and ran the image calibration step.
Below is a screenshot of the calibrated image geolocations after running the calibration step:
Figure 1.

Drone Mapping Windy Conditions - Drone Camera Geolocations
As you can see in the screenshot, each drone trajectory/flight path has a large variation in the number of images. The front overlap is not consistent at all and was the worst I have ever seen on a dataset.
Seeing this data is what made me want to write this article to explain what likely happened to this dataset and how UAV pilots can prevent this from happening to them.
**Before we continue, please read this website’s disclaimer on the use of the word “survey”.
Key Takeaways: How to Improve Drone Mapping in High Winds
Plan Flight Paths Smartly: Try flying perpendicular to the wind for better stability.
Adjust Flight Settings: Use distance interval shots with RTK instead of timed shots.
Monitor Battery & RTH Settings: High winds and cold weather drain batteries faster, so adjust Return-to-Home (RTH) triggers early.
Optimize Image Overlap: Lower flight speed in headwinds to prevent excessive images.
Drone Mapping Flight Planning
As mentioned earlier, drone pilots are constantly watching the weather forecast. Wind speed and wind direction is one of the key meteorological parameters we are looking for, usually weeks out from planned missions.
For drone mapping and survey missions, I always try to plan the flight trajectories, or flight paths, perpendicular to the wind direction which is known as flying crosswind. This provides the most stable and accurate flight for the drone. And it’s always better for the drone to turn into the wind direction, instead of away. We will get into that a bit more later.
Want to learn more about how we handle drone mapping? Check out our Drone Mapping Services.
I also do this so that the battery level indicator bar provides me with the most accurate battery level estimate which is extremely important for the Intelligent Return to home and Low Battery (RTH) Return To Home features.
You do not want the Low Battery RTH to trigger in high winds as the drone may not make it back to you if the wind has increased. This can be avoided by a number of steps, such as triggering the RTH when the drone is well above low battery RTH or when it has completed a flight path closest to you (the pilot). However, best practice for me is to do my best to plan the flight paths perpendicular to the wind if possible.
Having said that, you want your drone missions to be as efficient as possible while maintaining quality and accuracy and your mapping area won’t always align with the wind direction.
I’ve created a sample mapping mission below to explain a bit further.
In this example picture we are mapping a section of Highway 400 here in Ontario. The mapping area is approximately .63km2. Using the DJI M350 and P1 camera and flight altitude of 120m AGL (2.20 cm/pixel).
Naturally you would plan your flight as efficiently as possible, as shown below. The flight path/course angle matches the highway at approximately (107° / 350°). In fact, using the DJi Pilot 2 app will automatically configure the course angle this way as you draw in the mapping area. It does this automatically as it is the most efficient course angle to map this area without taking into account elevation changes or meteorological factors.

Figure 2 - Drone Mapping Windy Conditions - Head and Tail Wind
But what if we have high winds in the same direction as the drone course angle, with the drone flying downwind and upwind?
Would you change the course angle so the drone flies crosswind? Look at the example below, showing what that would look like.

Figure 3 - Drone Mapping Windy Conditions - Crosswind
The estimated flight duration increased by 46% while the image count increased by 42%. Clearly this is not a great approach, and is more of an example of when you would not use this method.
Other preflight considerations are terrain elevation changes, cloud cover and solar elevation angle. These will all affect visibility and visual line of sight for both the RPAS pilot as well as visual observers and other crew.
Best Drone Camera Settings
One of the features that our mapping drones and flight planning software have is a feature called Photo Mode.
Photo mode allows the user to pick between:
Timed Interval Shot
The drone automatically takes an image based on a preset time.
Distance Interval Shot
The drone automatically takes an image based on a preset distance.
Both time and distance photo mode intervals are calculated automatically using all of the flight parameters in the flight planning software. As you change flight parameters, flight altitude, speed, front and side overlap, etc. the software automatically calculates the intervals prior to uploading the flight mission to the drone.
And this is exactly why on the first example drone flight you see very inconsistent image spacing from the image geolocations.
Why did this happen?
The drone pilot flew that mission with Timed Interval Shot at full speed of 15 m/s.
The flight planning software, in this case, Pilot 2 App, calculated all the timed intervals based on the drone flying at 15m/s in all directions. This is why there are naturally more photos near the ends of the paths and on the turns, when the drone has to slow down before, during and after the turn.
When the drone was flying downwind it had no problem maintaining 15m/s and therefore the front overlap timed interval shot was as intended.
When the drone turned to come back flying in a headwind, it couldn’t reach the speed of 15 m/s because of the strong sustained wind and the wind gusts. The timed interval shot does not change and therefore, this is why you see many more photos on this headwind flight path. You can see in better detail in the image below.

Figure 4 - Drone Mapping Windy Conditions - Camera Geolocations Zoomed In
How to Fix Overlap Issues
Option 1: Don’t fly at full mapping speed using a timed interval.
When flying in head and tail winds, reduce the mapping speed based on max wind gusts calculated at flight altitude. I use the app UAV forecast, where you can calculate both ground level wind speed as well as desired altitude.
Basically you are trying to match the drone's speed when flying into the headwind.
Option 2: Change course angle for a majority crosswind.
In this case, the pilot could have flown the mission 90 degrees to this flight and fly in a crosswind which would have created a more constant image location distances.
However, after speaking to the pilot, the terrain elevations and visual site lines made the 107° / 350° course angle his preferred flight path. You can actually see this in the DSM, the elevation change of (15m).
Flying this course angle is preferred for lidar as the lidar FOV beam is more consistent with this flight pattern, which you would match the photogrammetry to the same course angle.
Learn more about how we use LiDAR in our mapping projects here: Drone LiDAR Services.
Option 3: Use the Distance Interval Photo Mode.
My opinion in this scenario, had I chosen to keep a headwind course angle, would be to use the Distance Interval Shot and reduce the mapping speed. I only recommend this when using an RTK base station on site for the entirety of the drone operation.
Because the drone is receiving GNSS Real-Time Kinematic corrections, the drones preprogrammed image intervals based on distance are not affected by the wind speed like the timed interval shots.
Even if the drone cannot reach full mapping speed of 15 m/s it will only take the photo when it has reached its next distance interval.
Real-World Flight Tests
To get a better understanding of these concepts, I took the Mavic 3 Enterprise (M3E) out on a windy day to do some test missions.
Here are some of the Mavic 3 Enterprise specs that are important to know for flying in wind:
The weather for the test flights:
Temperature: -3°C.
Wind Direction: SW 231° at
Wind Speed : 37km/h (10.28 m/s), gusting to 57km/h (15.83 m/s)
All 4 flights were planned using the DJI Pilot 2 App. Each missions parameters are below:
And here is a screenshots of both the weather app and flight plan for Flight 1:
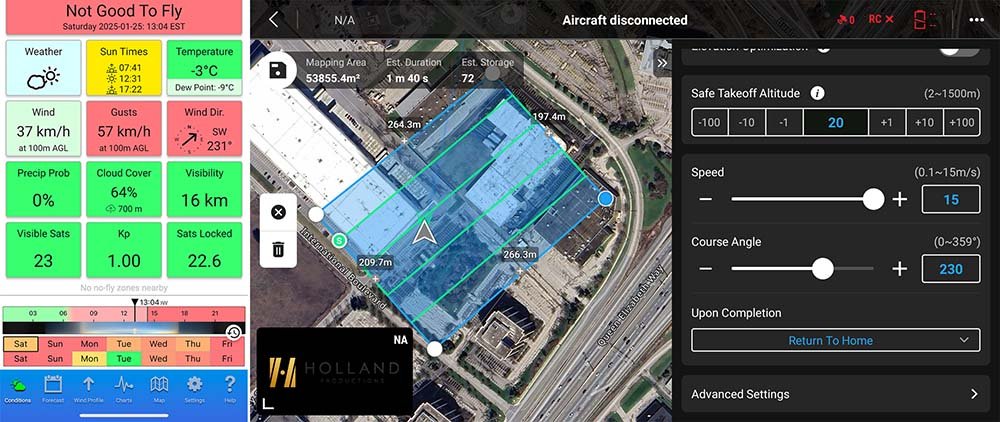
Figure 7 - Drone Mapping Windy Conditions - Weather App
As you can see, I aligned the course angle for Flight 1 & 2 to align with a perfect head/tail wind at 230° / 50°.
Flights 3 & 4 were aligned for a perfect crosswind at 320° / 140°
Camera Settings
White Balance: Cloudy
Exposure Settings: Shutter Priority (1/800)
ISO: Automatic
Mechanical Shutter: On
Flight Observations With Sample Flight Videos
Let’s take a look at the real word flight parameters and see how DJI’s adaptive flight controls and wind speed algorithms handle the 4 sample flights
Sample Flight Video
Mapping in Head and Tail Wind - Timed vs Distance
Flight 1
Flight 1 is the scenario in Figure 1 where the drone images were not constantly spaced evenly for an efficient photogrammetry mapping mission.
If you watch the video, you can see the M3E has no issue reaching the programmed speed of 15m/s on the tailwind path. You can hear the images being captured at regular intervals, even as the drone slows down to about 6m/s to make the turn, resulting in more images being taken.
You can see this information in Figure 8 below, which is a screenshot from Flight 1’s video. The drone is heading 050°, wind speed maxes at 10.1m/s and the arrow to the right of “10.1” shows the wind is from the rear of the drone (tailwind). Below that you see the drone speed of 15.2 m/s. Slightly (0.2m/s) faster than the max mapping speed.

Figure 8 - Drone Mapping Windy Conditions - Flight 1 Nav (050)
On the return path during Flight 1 (229°) into the headwind the M3E’s mapping speed is reduced to a maximum of 12.7 m/s, even with a slightly less calculated wind speed at 8.3 m/s. You can see in the video screenshot below.

Figure 9 - Drone Mapping Windy Conditions - Flight 1 Nav (230)
Using the timed interval shots will result in more images being taken on these legs of the mapping runs, as well as the turns just like we saw in our original data set.
Flight 2
Flight 2 has the exact same mapping settings other than changing the photo mode to Distance Interval. You can see in the video that the M3E actually sustains stronger wind gusts, slowing the drone down to approximately 8.6 m/s when flying in the headwind.
But you can hear the photo intervals are not consistent like they were with the timed interval, because of the variable speed of the drone and using distance as the target when to take the image capture.
Let’s see what that looks like for both Flight 1 timed shots and Flight 2’s distance shots. Figure 10 below shows the camera locations from the Pix4d Matic quality report.
You can see that the timed interval shot was estimated to take 72 images when it was planned in the flight planning software, but actually took 81.
The distance interval mapping mission was estimated at 56 but actually took 55 images.
The timed interval shot took 26 (47.27%) more photos than the distance interval shot for the exact same mapping area.
Image Overlap Quality - Flight 1 & 2
Next lets compare the image overlap from the quality report of both flights.
The overlap is sufficient in both datasets. Proving that the 47.27% extra images does not make a significant difference in the overlap quality for mapping with the purpose of creating a 2D orthomosaic.
I know this is a very small data set that does not reflect real world mapping projects, but for all 4 flights the wind was fairly consistent and the results show for themselves.
Mapping in Crosswind - Timed vs Distance
Now let's take a look at flights 3 & 4 which were both flown in a crosswind which was exactly 90 degrees from flights 1 & 2 .
Flights 3 & 4 both reach the set mapping speed of 15 m/s even showing crosswinds up to 12.6 m/s. Both flights have consistent speed (14.6 - 15.2) in both mapping course directions during the middle of the flight paths.
Let’s see what that looks like for both Flight 3 timed shots and Flight 4’s distance shots. Figure 12 below shows the image locations from the Pix4d Matic quality report.
The timed interval shot was estimated to take 91 images but took 94 images.
The distance interval mapping mission was estimated at 68 but took 66 images.
The timed interval shot took 28 (42.42%) more photos than the distance interval shot for the same mapping area.
Image Overlap Quality - Flight 3 & 4
Again, we will compare the image overlap from the quality report of both flights.
Similar to Flights 1 & 2, the overlap is sufficient in both datasets. This proves once again that the extra images do not make a significant difference in the image acquisition overlap quality for 2D mapping with the purpose of creating a 2D orthomosaic.
Vertical Camera Positions
In Figure 14 below, you can see the vertical camera positions for each flight. And each camera position shows the initial, optimized and uncalibrated positions/cameras.
The initial cameras (blue dots) are the camera positions from GPS from each image.
The optimized cameras (green dots) are where Pix4D has actually calculated the camera positions to be after the calibration step and creating tiepoints.
You will notice they are very accurate because I used RTK for these flights.
The other key thing to notice is that for flights 1 & 2 the drone had a much harder time staying at the mapping altitude of 100m AGL, which is expected when flying in head and tail winds. The vertical dispersion of 130cm and 86.3cm, compared to flights 3 & 4 which were very similar at 59.1cm & 55.7cm.
Flights 3 & 4 are much more stable flights, with more stable positions in altitude when flying in crosswind. Although, you may notice when watching the videos, that both crosswind flights 3 & 4 did have a bit more yaw & kappa instability from the crosswind gusts, I always prefer more stability and accuracy in the Z axis as this is more difficult to achieve than x and y.
One other thing to mention is that both flights 3 & 4 mapping courses were not exactly planned correctly for the best stability. I should changed the start position of both missions to start further away (from the wind direction). This way the drone will turn into the wind on each pass, not turn away.
The drone is more aerodynamic flying forward and has the most thrust flying forward, therefore turning into the wind rather than away is a better practice. This was an oversight when I copy and pasted the missions for these tests!
From the sample flights, it’s clear how different flight settings can impact mapping efficiency. Now, let’s look at the quality report to compare results in even more detail.
Other Metrics From the Quality Report
What do these results from the quality reports show?
Typically, having higher median matches per image and ATPs is desired when processing photogrammetry. And seeing flights 1 & 3 have much higher numbers is not surprising. When processing more images, you have more matches as there are more overlapping images for the software to extract the tiepoint matches.
But going black to the overlap chart, you see that there needs to be a cost/benefit analysis for this. The cost being data collection time on site and photogrammatic processing time and the benefit being a quality and accurate orthomosaic.
The parameters in the distance interval shots are all very acceptable, other than the Z error on flight 2 which was an anomaly. You can actually see this near the end of flight 2 the third or 4th last photo before the end of the mission, a gust of wind pushes the drone up quickly. See figure 16 below.

Figure 16 - Drone Mapping Windy Conditions - Large Z Axis Error for single image
Crosshatch Flight Pattern
I focused this article on 2D mapping, and did not discuss 3D mapping for creating models and twins. This requires a much different approach and one method that can be utilized is the crosshatch pattern.
When mapping 3D structures, a cross hatch flight pattern is a fantastic way to get accurate terrain while getting side structure details as well.
I will cover this in another blog, as I just realized this blog is already incredibly long!
Wind Speed Resistance In Low Temperatures
Battery capacity is significantly reduced in cold temperatures. Keeping the drone batteries warm prior to flying is very important. Hovering the drone in place prior to starting a mapping mission is a recommended practice.
The low battery capacity will affect the drones wind resistance capabilities, so please keep that in mind.
Final Thoughts & Key Takeaways
Drone Mapping with high winds is never ideal. But by using the correct flight planning parameters, you can still achieve efficient, high quality and accurate results.
Large scale mapping jobs are sometimes hundreds to thousands of acres. Depending on the terrain and GSD for the client this can be over 10,000 images per jobsite. Adding an additional 47% of images that don’t necessarily increase accuracy or quality, just simply does not work for me. This is why I use distance interval shots for RTK photogrammetry mapping and survey work in windy conditions, especially when the course angle does not allow for flying crosswinds.
But remember this is just another tool and not set in stone. Every single mapping project is different and as the pilot in command, you need to make the best decisions for you and your mapping missions.
I hope the tests I have done have provided you with some useful information to help you best make flight parameter decisions on your next windy mapping or survey mission.
Key Takeaways:
Wind speed & direction matter – Always plan flights perpendicular to the wind when possible.
Adjust flight settings – Use distance interval shots with RTK instead of timed shots in high-wind conditions.
Watch battery life & RTH – High winds drain batteries faster, so adjust your Return-to-Home (RTH) triggers accordingly.
Stabilize image overlap – Lower flight speed in headwinds to prevent unnecessary extra images.
By implementing these strategies, you can minimize wind-related errors while improve efficiency on every mapping mission.
What’s Your Experience with Windy Drone Mapping?
Have you encountered high-wind mapping challenges before? What settings or strategies have worked for you?
Drop a comment below with your thoughts & experiences—I’d love to hear from other drone pilots!
All the best,
Craig